
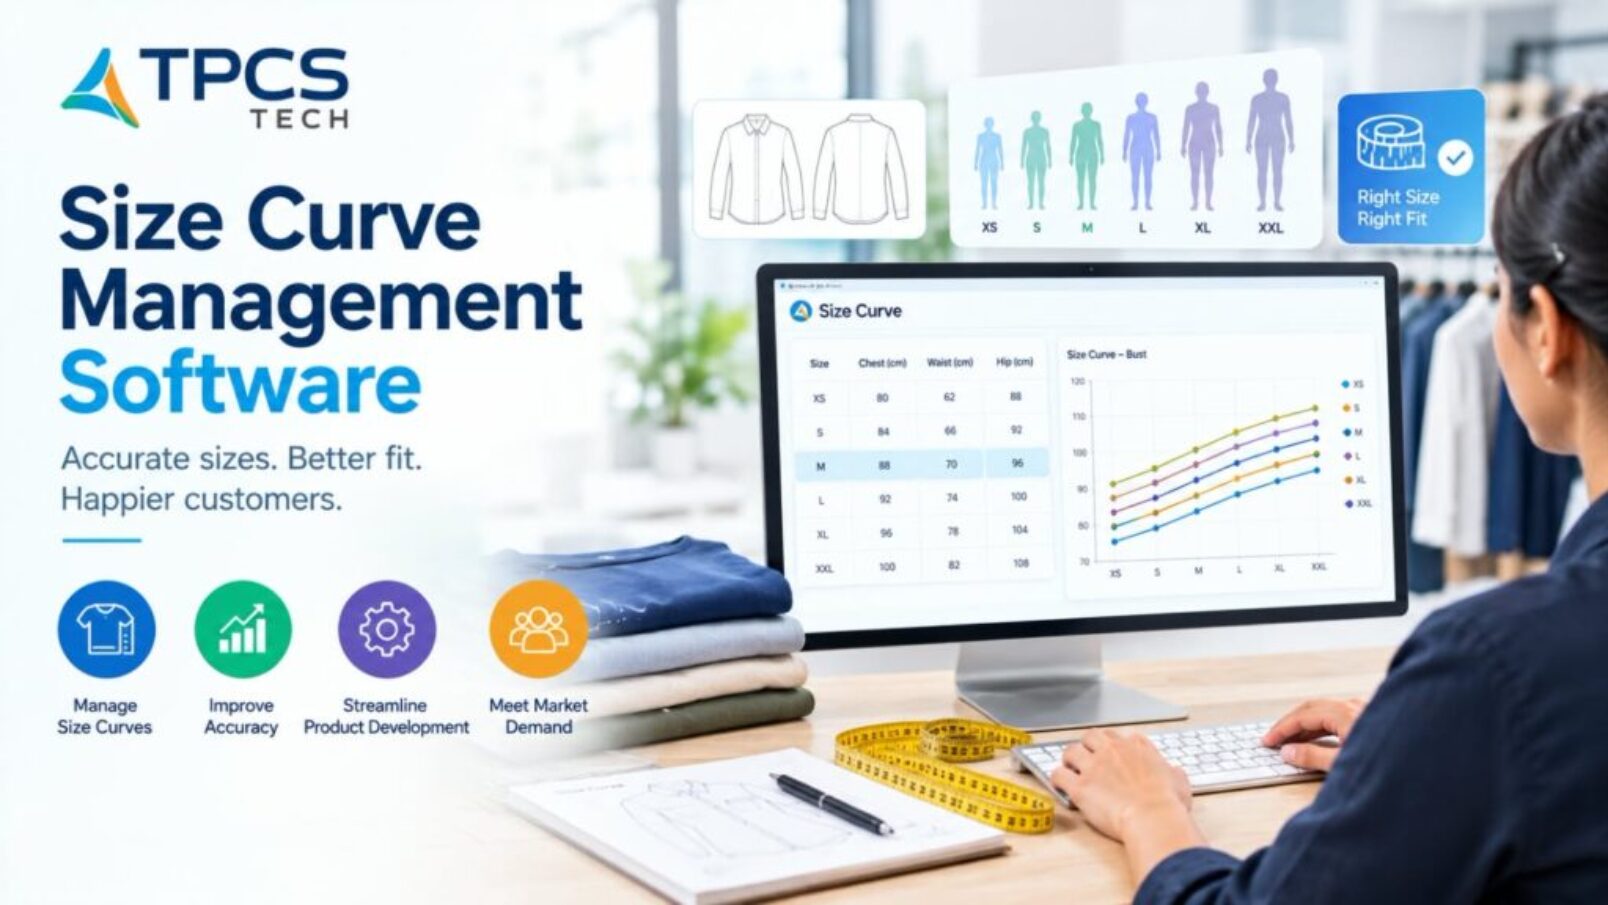
TL;DR: Size curve management software works out how many units of each size to make or buy for a style, based on what actually sold, and carries that size mix into orders, BOMs and cut plans. Getting the curve right cuts end-of-season markdowns on slow sizes and lost sales on sizes that sell out early.
Picture a Bengaluru menswear brand at the end of its summer season. In its north Indian stores, XL and XXL shirts sold out within weeks. In its southern stores, a pile of XL and XXL is going into the sale rack, while size M sold out early.
Every store had received the same size ratio: S, M, L, XL, XXL in 1:2:2:2:1. The brand’s total sell-through looked acceptable. The size-level picture told a different story: lost sales in one region, markdowns in another, on the same style.
What is a size curve in apparel?
Definition: A size curve is the share of total units allocated to each size for a style, a category or a group of stores, for example 10% S, 25% M, 30% L, 25% XL and 10% XXL. Size curve management software builds these curves from sales data and applies them to buying, production orders, BOMs and cut plans.
Manufacturers often call it the size ratio. Retail planners call it the size curve or size profile. It’s the same idea viewed from either end of the supply chain.
Why one size ratio for everyone doesn’t work
Body sizes vary by region, age group and customer segment. A slim-fit shirt sells a different size mix from a relaxed fit. A college-town store sells differently from a store in a business district.
Using one company-wide ratio averages all of that away. You end up short in some sizes and overstocked in others, even when the total quantity was right.
How a size curve is built
Start from sell-through, not just sales
Raw sales by size are misleading. If size M sold out in week three, its sales stopped because there was nothing left, not because demand stopped. Good size curve tools adjust for stockouts, or at least use only the weeks when every size was available.
Group stores into clusters
Building a curve for every store is noisy unless each store sells a lot. Most brands group stores with similar size behaviour into clusters, then build one curve per cluster.
Build curves by category and fit
Shirts, trousers, kurtas and T-shirts each have their own curves. So do slim, regular and relaxed fits within a category.
Check against minimum pack and ratio rules
Factories pack and ship in ratio packs. A curve that says 13% S is only useful once it’s rounded into a packable ratio.
An illustrative example
These numbers are made up to show the idea. Your own data will look different.
| Size | Single company ratio | North cluster curve | South cluster curve |
| S | 12.5% | 8% | 15% |
| M | 25% | 20% | 30% |
| L | 25% | 25% | 27% |
| XL | 25% | 30% | 20% |
| XXL | 12.5% | 17% | 8% |
Visual suggestion: Side-by-side bar chart of the two cluster curves against the single company ratio.
With these curves, the north cluster gets more XL and XXL, the south gets more S and M, and the total buy can stay the same.
From size curve to production: where manufacturers come in
For a brand, the size curve decides what to buy. For the manufacturer, it decides almost everything that follows.
Size-wise order breakdown. The buyer’s PO arrives with quantities per size and colour, built from the curve.
Size-wise BOM consumption. Larger sizes use more fabric. If fabric is booked on an average consumption, a curve skewed to big sizes will leave you short. Our guide on what BOM means in garment manufacturing explains size-wise consumption.
Cut planning and markers. The cutting team builds markers around the size ratio. A ratio that doesn’t divide cleanly into lays wastes fabric or forces extra markers.
Packing. Ratio packs and carton plans follow the same curve, store cluster by store cluster.
If any of these steps uses a different ratio from the one in the order, the error shows up as short sizes at packing.
What size curve management software should do
- Pull sales and stock data by style, size and store, and adjust for stockouts.
- Build curves by category, fit and store cluster, and let planners review them before use.
- Round curves into practical ratio packs.
- Push size quantities into purchase orders and production orders.
- Carry the size mix into the BOM so material requirements are correct by size.
- Show, after the season, how actual sell-through compared with the curve, so next season’s curve improves.
When does a brand or manufacturer need this?
If you sell through fewer than a handful of stores, a spreadsheet with a few seasons of size-wise sales may be enough.
Software starts paying off when you have many stores, several regions or channels (stores, marketplaces, your own website) with different size behaviour, or when end-of-season markdowns concentrate in the same sizes every time.
For manufacturers, the trigger is different: repeated short or excess sizes at packing, or fabric shortfalls on big-size-heavy orders. That points to the size ratio not flowing cleanly from order to BOM to cutting, which is a PLM and ERP problem as much as a planning one. See what is apparel ERP.
Editor note (remove before publishing): Add one real, anonymised example (brand or manufacturer) where size-wise planning changed outcomes, if available from TPCS customers.
Frequently asked questions
What is a size curve in retail?
It is the percentage of units allocated to each size for a style or group of stores, built from past sales, so each store gets a size mix that matches its customers.
What is the difference between size curve and size ratio?
They describe the same thing. Retail planners usually say size curve; manufacturers usually say size ratio, often expressed as whole numbers like 1:2:2:1.
How do you calculate a size curve?
Take size-wise sales for a category over periods when all sizes were in stock, convert them to percentages, group stores with similar patterns and round the result into practical pack ratios.
Why does size curve matter to garment manufacturers?
Because fabric consumption, markers, cutting and packing all depend on the size mix. A wrong ratio causes fabric shortages and short sizes at packing.
Can size curves differ by fit?
Yes. Slim, regular and relaxed fits of the same category usually sell different size mixes, so they should have separate curves.