
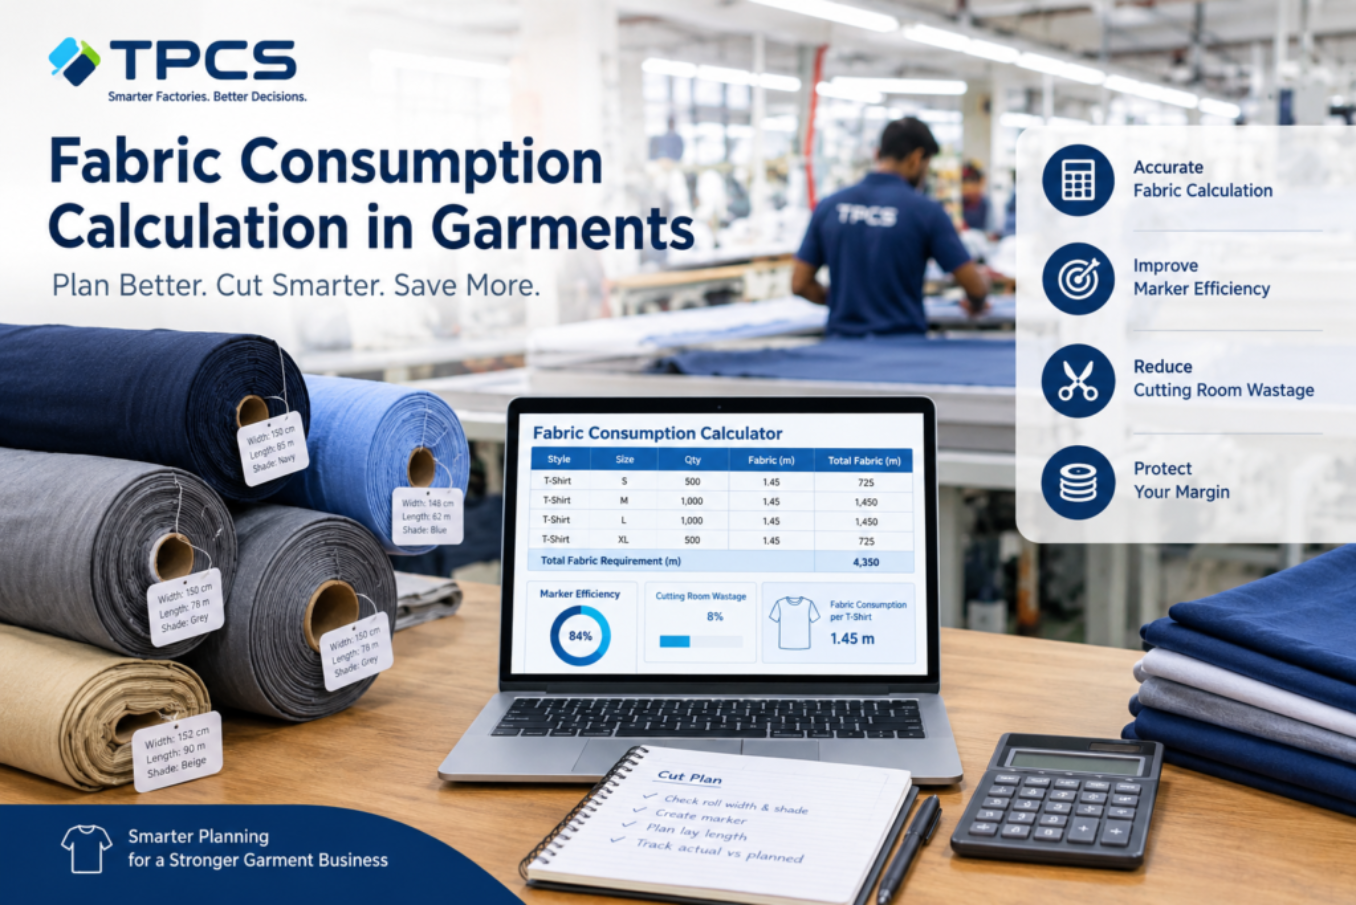
Fabric Consumption
Fabric consumption is the quantity of fabric needed to make one garment (or one dozen). For knits, it is usually calculated by weight using body measurements and fabric GSM. For wovens, it is taken from the marker: marker length divided by the number of garments in the marker, plus allowances for end loss and width variation. Most cutting-room losses come from the gap between costed consumption and actual consumption, which is why you must track consumption lay by lay, not just at costing stage.
The 7-paise problem nobody noticed
This is a composite scenario drawn from situations we see often in Indian factories.
Karthik runs production at a 400-machine woven shirt unit in Peenya, Bengaluru. In March, the merchandising team booked 24,000 men’s shirts for a UK retailer. Costing assumed 1.45 metres of fabric per shirt. The margin was thin, but workable.
By the time the last carton left the factory, the store ledger showed the cutting room had actually used 1.52 metres per shirt.
Seven centimetres per piece does not sound like much. But 0.07 m × 24,000 shirts is 1,680 metres. At ₹180 per metre, that is ₹3,02,400, quietly gone. Nobody stole anything. Nobody was careless on purpose. The fabric just leaked out through narrow rolls, a few extra plies, end bits that were too short to use, and a marker that was made for a 148 cm width when half the rolls came in at 144 cm.
Karthik’s question to us was simple: “How do I catch this during the order, not after the shipment?”
That is what this guide answers.
Why fabric consumption goes wrong
Fabric is usually the single largest cost in a garment, often more than half of the FOB price, so a small consumption error hits profit harder than almost anything else on the shop floor. The usual culprits:
- Costing done on a “standard” figure. Merchandisers often reuse last season’s consumption for a similar style without re-checking the new pattern.
- Marker made for the wrong width. The marker assumes the width on the purchase order, not the usable width of the rolls actually received.
- No roll-wise data. If you don’t know each roll’s width, length and shade, you can’t group rolls properly before laying.
- End loss and splicing loss ignored. Every lay loses a few centimetres at each end. Across hundreds of plies, that adds up fast.
- Recuts and replacements not recorded. Damaged panels get recut from fresh fabric, but nobody adds that back into actual consumption.
How to Calculate Fabric Consumption in Garments
Knit fabric is bought by weight, so consumption is calculated in kilograms per dozen.
Formula:
Body consumption (kg/dozen) = [(Body length + Sleeve length + Allowance) × (½ Chest + Allowance) × 2 × GSM] ÷ 10,000,000 × 12
Worked example (basic crew-neck T-shirt, size M):
- Body length 72 cm + sleeve length 22 cm + allowance 6 cm = 100 cm
- Half chest 52 cm + allowance 4 cm = 56 cm
- Fabric: 180 GSM single jersey
Calculation: 100 × 56 × 2 × 180 = 20,16,000 → ÷ 10,000,000 = 0.2016 → × 12 = 2.42 kg per dozen (net)
Now add process and cutting wastage. If your historical cutting wastage for this style is around 10%, your gross requirement becomes about 2.66 kg per dozen. Rib, neck tape and other components are calculated separately and added.
How to calculate fabric consumption for wovens (shirts, trousers)
For wovens, the marker is your truth.
Consumption per piece = Marker length ÷ Number of garments in the marker
Marker efficiency = (Total area of pattern pieces ÷ Total marker area) × 100
Worked example (shirt, 4-piece marker):
- Marker length: 6.2 m
- Usable fabric width: 150 cm (1.5 m)
- Marker area: 6.2 × 1.5 = 9.3 m²
- Total pattern area for 4 shirts: 7.9 m²
Marker efficiency = 7.9 ÷ 9.3 × 100 = 84.9%
Consumption = 6.2 ÷ 4 = 1.55 m per shirt, before end loss and other allowances.
Marker efficiency for most apparel commonly sits somewhere between the high 70s and high 80s, depending on the product, the number of sizes in the marker and whether the fabric has a directional print, stripe or check. Checks and stripes always cost you more.
Fabric consumption: where the leaks actually happen
| Leak point | What causes it | How to control it |
|---|---|---|
| Width variation | Rolls narrower than marker width | Capture actual width per roll at inspection; make markers by width group |
| End loss | Extra fabric left at both ends of each ply | Set a standard (e.g., 2–3 cm per end) and track actual per lay |
| Splicing loss | Overlap where a new roll or defect starts mid-lay | Mark splice points on the marker; use roll-wise allocation |
| Short end bits | Leftover pieces too small for another ply | Plan lay lengths against actual roll lengths before laying |
| Shade variation | Mixed shades forcing extra cutting or rejects | Shade-band rolls and lay by shade group |
| Recuts | Damaged or mis-cut panels replaced | Record recut fabric against the same order |
The cut plan: where costing meets reality
A cut plan translates the order (sizes, colours and quantities) into lays and markers. A good cut plan answers four questions before the first ply is laid:
- What size ratio goes into each marker? If the order is S:M:L:XL in a 1:2:2:1 ratio, you might combine sizes so that one marker covers one full ratio set.
- How many plies per lay? This is limited by the cutting machine’s safe lay height, the fabric type and table length.
- Which rolls go into which lay? Group by width and shade so the marker fits and shading doesn’t mix in one garment.
- What is the planned consumption for this lay? So you can compare it with actual consumption the moment the lay is cut.
When the cut plan is on paper, step 4 rarely happens. When it is in a system, every lay closes with “planned vs actual” automatically.
A practical 6-step routine for your cutting room
- Inspect and record every roll for width, length, GSM or weight, and shade before it reaches the cutting table.
- Re-check consumption at sample stage using the final approved pattern, not last season’s figure.
- Make markers by width group rather than one marker for the whole order.
- Issue fabric against a lay, not against an order. The store should know exactly which rolls went to which lay.
- Close each lay with actual consumption, including end bits and recuts.
- Review the variance daily. If a style is running 3% over costing on day two, you still have time to fix the marker.
Where software helps (and where it doesn’t)
Software won’t make your marker more efficient on its own. That still needs a good pattern master and a CAD marker. What a system like TPCS does is close the loop around the marker:
- Roll-wise fabric QC and barcoding captures width, length and shade for every roll at receiving.
- Cut plan and bundle tracking stores the size ratio, lays and plies, and calculates planned consumption per lay.
- Fabric planning and process estimation pulls consumption straight from the costing and BOM, so the cutting room and merchandising use the same number.
- Order closing (P&L) shows costed vs actual fabric per order, so the next quotation for a similar style uses real data.
The point is simple: if planned and actual consumption sit side by side every day, a 7-paise leak gets caught on day two, not after shipment.
How Karthik’s story ended
For the next order, Karthik’s team started recording roll widths at inspection and grouping rolls into two width bands before making markers. They closed every lay with actual consumption and reviewed variance at the 10 am production meeting.
On a 20,000-piece repeat order, the variance against costing dropped to under 1%. That alone covered the cost of the extra steps several times over. More importantly, merchandising stopped guessing at consumption for new quotes.
Frequently asked questions
What is the formula for fabric consumption of a T-shirt?
For knit T-shirts: [(Body length + Sleeve length + Allowance) × (½ Chest + Allowance) × 2 × GSM] ÷ 10,000,000 × 12 gives kilograms per dozen. Add wastage based on your own cutting history.
What is a good marker efficiency in garment manufacturing?
It depends on the product. Basic solid-colour garments with several sizes in one marker often reach the mid-to-high 80s. Checks, stripes, directional prints and single-size markers usually run lower.
What is the difference between fabric consumption and fabric utilization?
Consumption is how much fabric one garment needs. Utilization (or marker efficiency) is the percentage of fabric that actually ends up inside garment panels rather than as waste.
How do I reduce fabric wastage in the cutting room?
Record roll-wise width and shade, make markers by width group, plan lay lengths against actual roll lengths, set an end-loss standard, and compare planned vs actual consumption after every lay.
Can fabric consumption be calculated in ERP software?
Yes. Apparel ERP systems store consumption in the BOM and costing, then compare it with actual issue and cutting data. TPCS does this through its costing, MRP and cut plan modules.
Ready to see your planned vs actual fabric, lay by lay?
If your team still finds consumption variance only at order closing, book a 30-minute TPCS demo. We’ll walk you through cut planning, roll-wise QC and order-level fabric P&L using a sample style from your own factory.